Note
Go to the end to download the full example code.
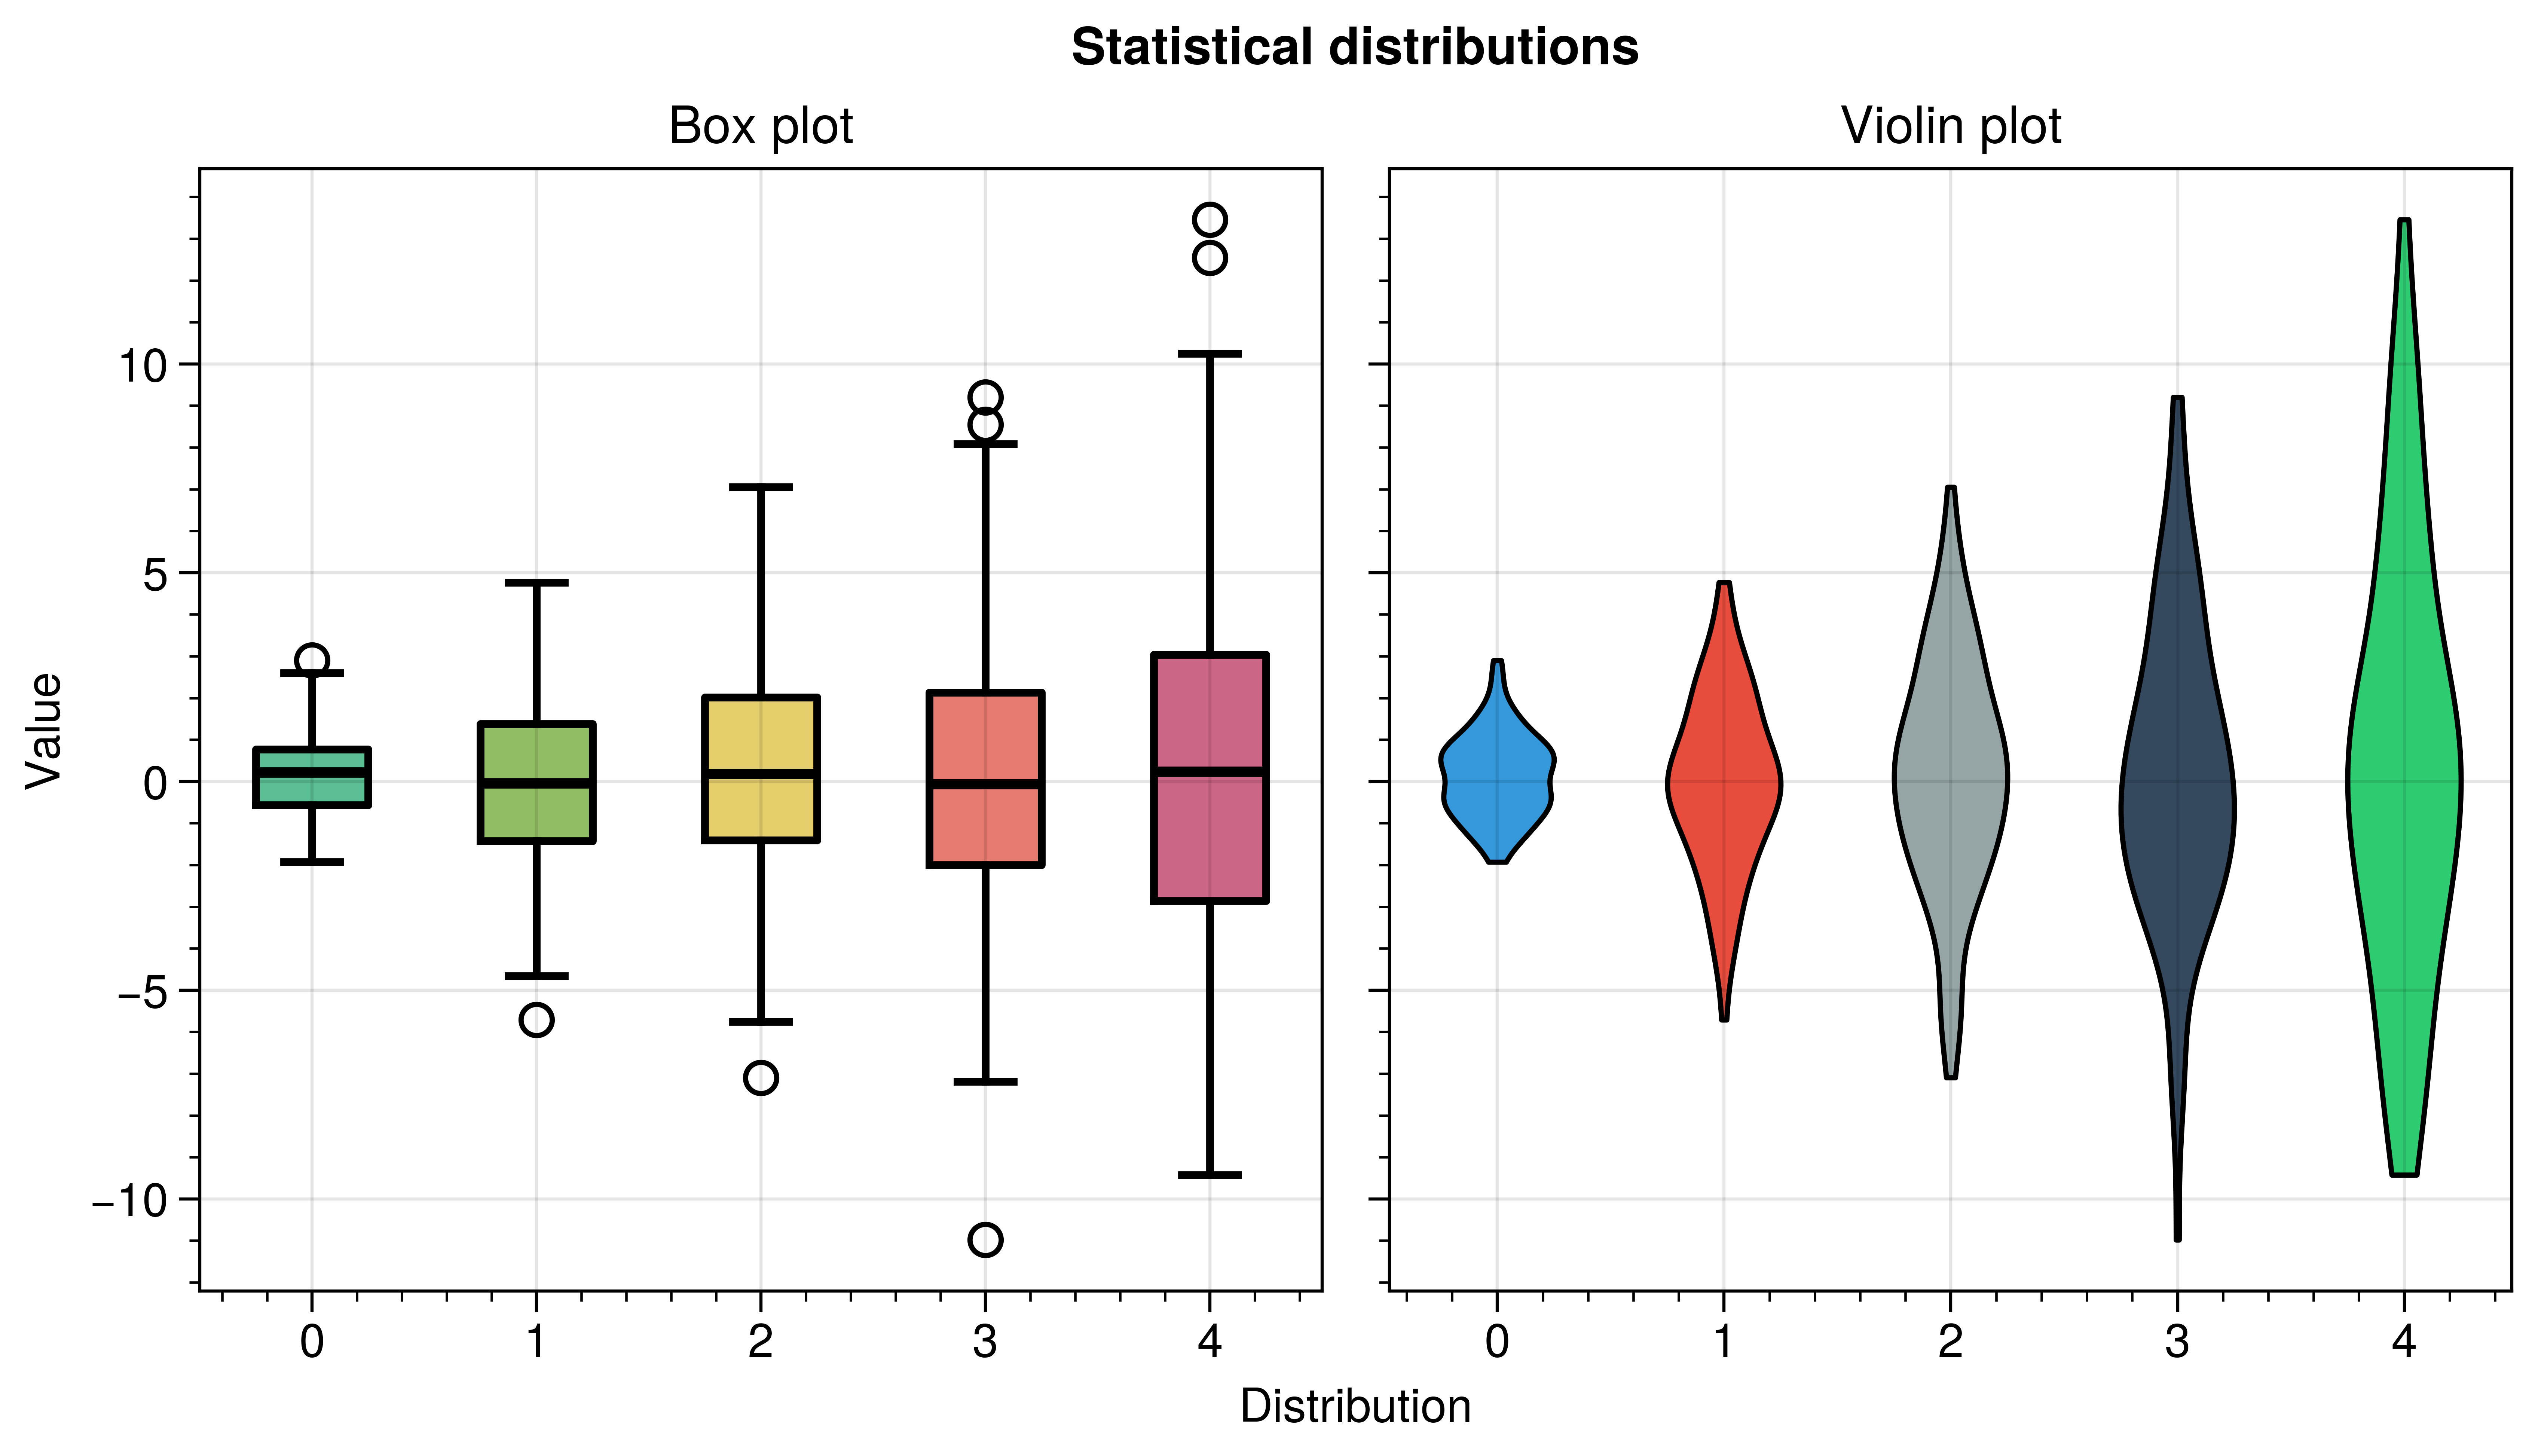
Box and violin plots
Standard box and violin plots with automatic customization.
Why UltraPlot here?
UltraPlot wraps matplotlib.axes.Axes.boxplot() and matplotlib.axes.Axes.violinplot()
with more convenient arguments (like fillcolor, alpha) and automatically applies
cycle colors to the boxes/violins.
Key functions: ultraplot.axes.PlotAxes.boxplot(), ultraplot.axes.PlotAxes.violinplot().
See also
import numpy as np

import ultraplot as uplt

# Generate sample data
data = np.array([np.random.normal(0, std, 100) for std in range(1, 6)])

fig, axs = uplt.subplots(ncols=2, refwidth=3)

# Box plot
axs[0].boxplot(data.T, lw=1.5, cycle="qual1", medianlw=2)
axs[0].format(title="Box plot", xlabel="Distribution", ylabel="Value")

# Violin plot
axs[1].violinplot(data.T, lw=1, cycle="flatui")
axs[1].format(title="Violin plot", xlabel="Distribution", ylabel="Value")

axs.format(suptitle="Statistical distributions")
uplt.show(block=1)
fig.show()