Note
Go to the end to download the full example code.
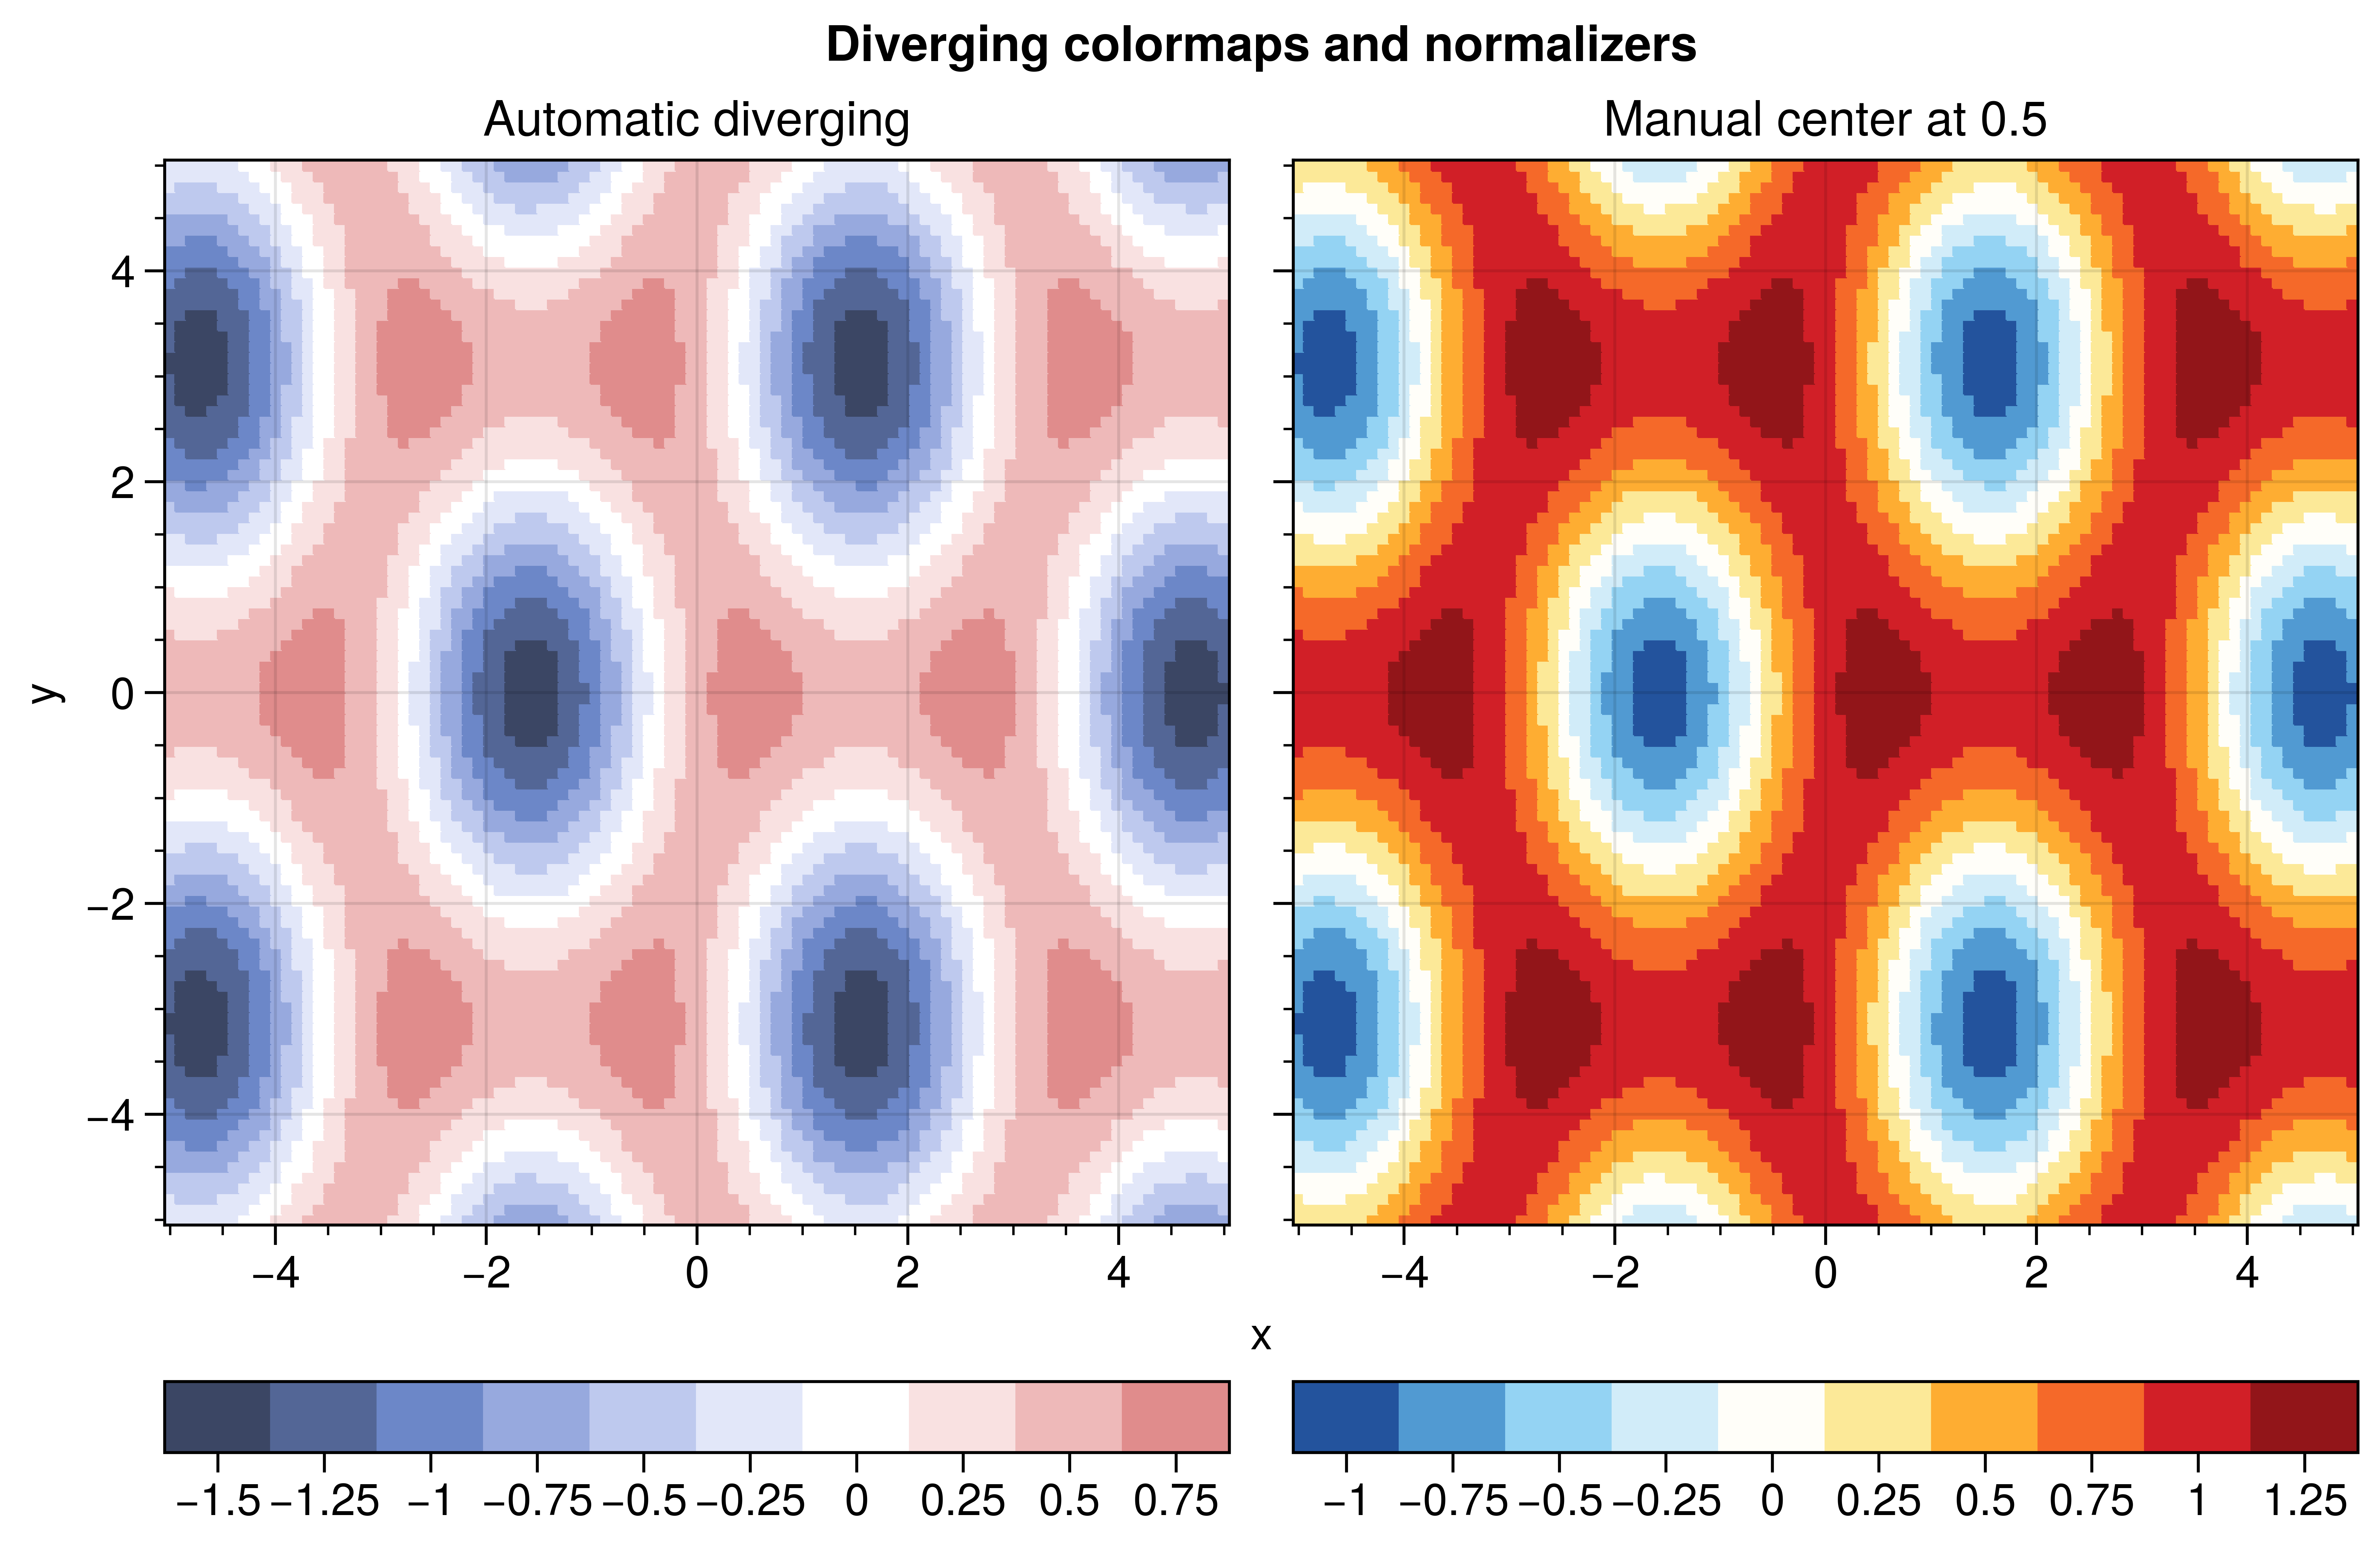
Diverging colormap
Use a diverging colormap with centered normalization.
Why UltraPlot here?
UltraPlot can automatically detect diverging datasets (spanning negative and positive values) and apply a diverging colormap with a centered normalizer. This ensures the “zero” point is always at the center of the colormap.
Key functions: ultraplot.colors.DivergingNorm, ultraplot.axes.PlotAxes.pcolormesh().
See also
import numpy as np

import ultraplot as uplt

# Generate data with negative and positive values
x = np.linspace(-5, 5, 100)
y = np.linspace(-5, 5, 100)
X, Y = np.meshgrid(x, y)
Z = np.sin(X) * np.cos(Y) + 0.5 * np.cos(X * 2)

fig, axs = uplt.subplots(ncols=2, refwidth=3)

# 1. Automatic diverging
# UltraPlot detects Z spans -1 to +1 and uses the default diverging map
m1 = axs[0].pcolormesh(X, Y, Z, cmap="Div", colorbar="b", center_levels=True)
axs[0].format(title="Automatic diverging", xlabel="x", ylabel="y")

# 2. Manual control
# Use a specific diverging map and center it at a custom value
m2 = axs[1].pcolormesh(
    X,
    Y,
    Z + 0.5,
    cmap="ColdHot",
    diverging=True,
    colorbar="b",
    center_levels=True,
)
axs[1].format(title="Manual center at 0.5", xlabel="x", ylabel="y")

axs.format(suptitle="Diverging colormaps and normalizers")
fig.show()
Total running time of the script: (0 minutes 1.170 seconds)