Note
Go to the end to download the full example code.
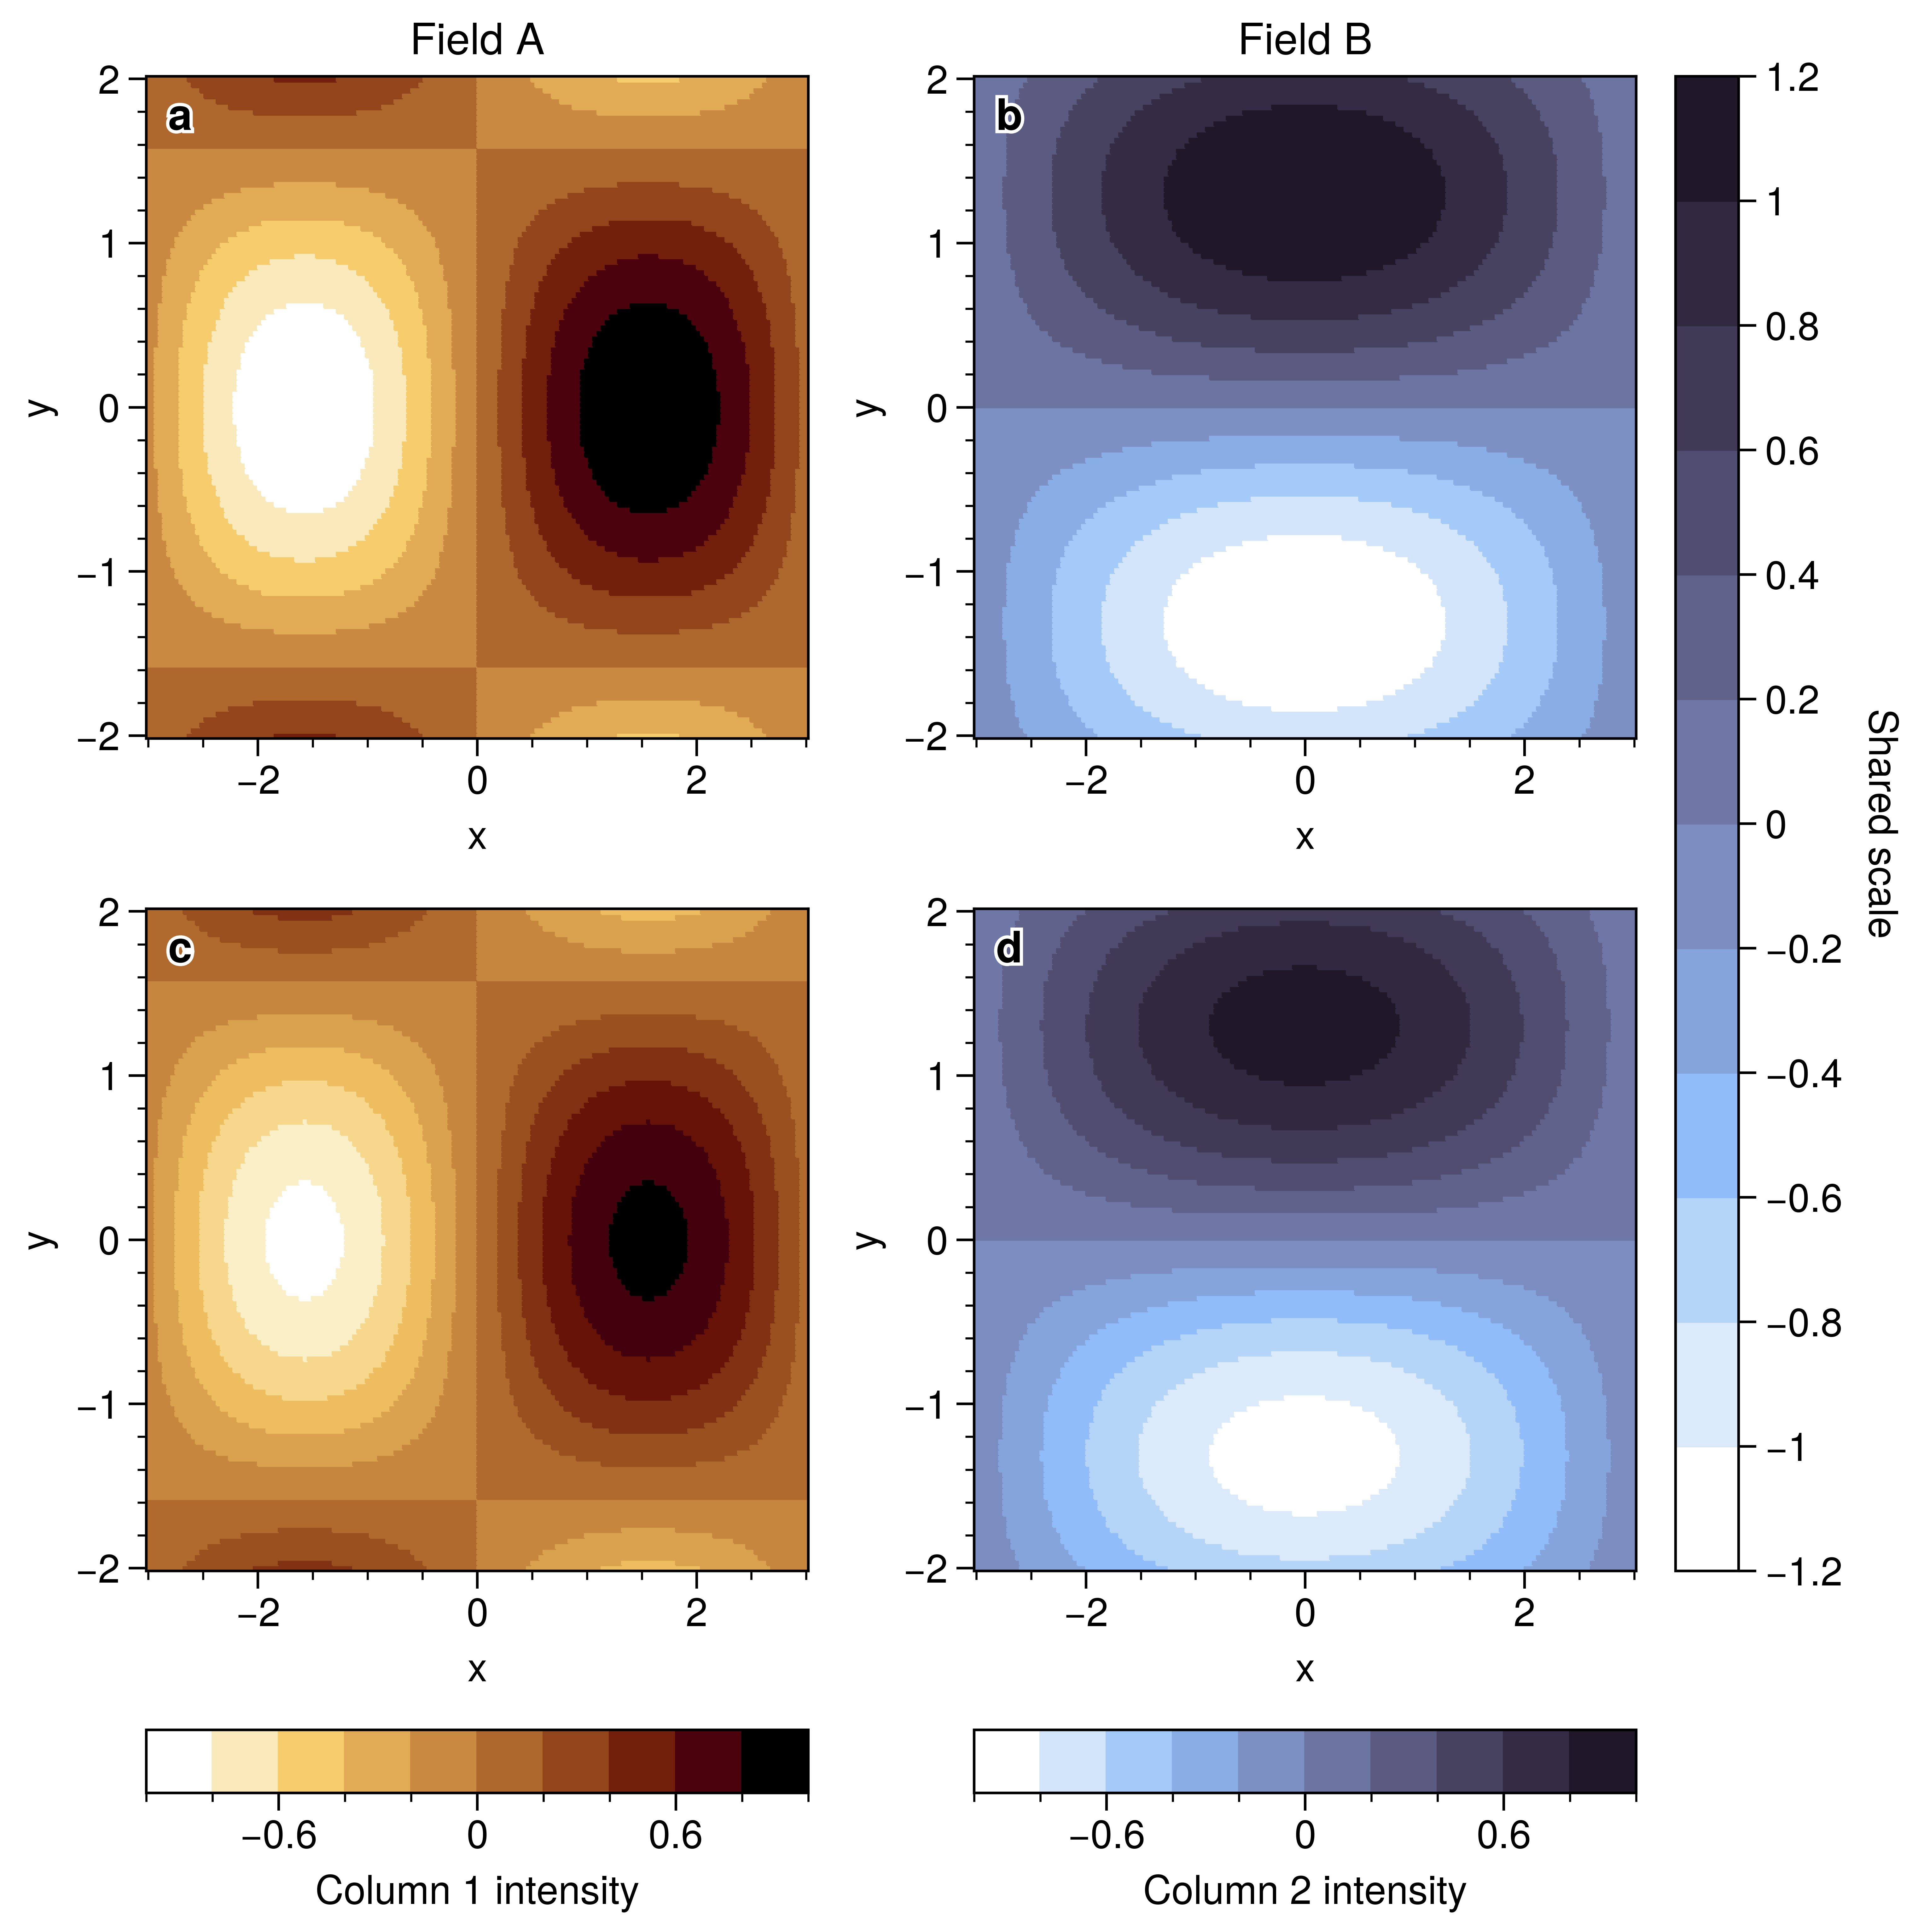
Multi-panel colorbars
Column-specific and shared colorbars in a 2x2 layout.
Why UltraPlot here?
UltraPlot places colorbars by row/column with fig.colorbar so multi-panel
figures can share scales without manual axes placement. This mirrors the
publication layouts often seen in journals.
Key functions: ultraplot.figure.Figure.colorbar(), ultraplot.axes.PlotAxes.pcolormesh().
See also
import numpy as np

import ultraplot as uplt

x = np.linspace(-3, 3, 160)
y = np.linspace(-2, 2, 120)
X, Y = np.meshgrid(x, y)

fig, axs = uplt.subplots(nrows=2, ncols=2, share=0, refwidth=2.1)
data_left = np.sin(X) * np.cos(Y)
data_right = np.cos(0.5 * X) * np.sin(1.2 * Y)

m0 = axs[0, 0].pcolormesh(X, Y, data_left, cmap="Stellar", shading="auto")
m1 = axs[1, 0].pcolormesh(X, Y, data_left * 0.8, cmap="Stellar", shading="auto")
m2 = axs[0, 1].pcolormesh(X, Y, data_right, cmap="Dusk", shading="auto")
m3 = axs[1, 1].pcolormesh(X, Y, data_right * 1.1, cmap="Dusk", shading="auto")

axs.format(xlabel="x", ylabel="y", abc=True, abcloc="ul", grid=False)
axs[0, 0].set_title("Field A")
axs[0, 1].set_title("Field B")

fig.colorbar(m0, loc="b", col=1, label="Column 1 intensity")
fig.colorbar(m2, loc="b", col=2, label="Column 2 intensity")
fig.colorbar(m3, loc="r", rows=(1, 2), label="Shared scale")

fig.show()
Total running time of the script: (0 minutes 1.541 seconds)