Note
Go to the end to download the full example code.
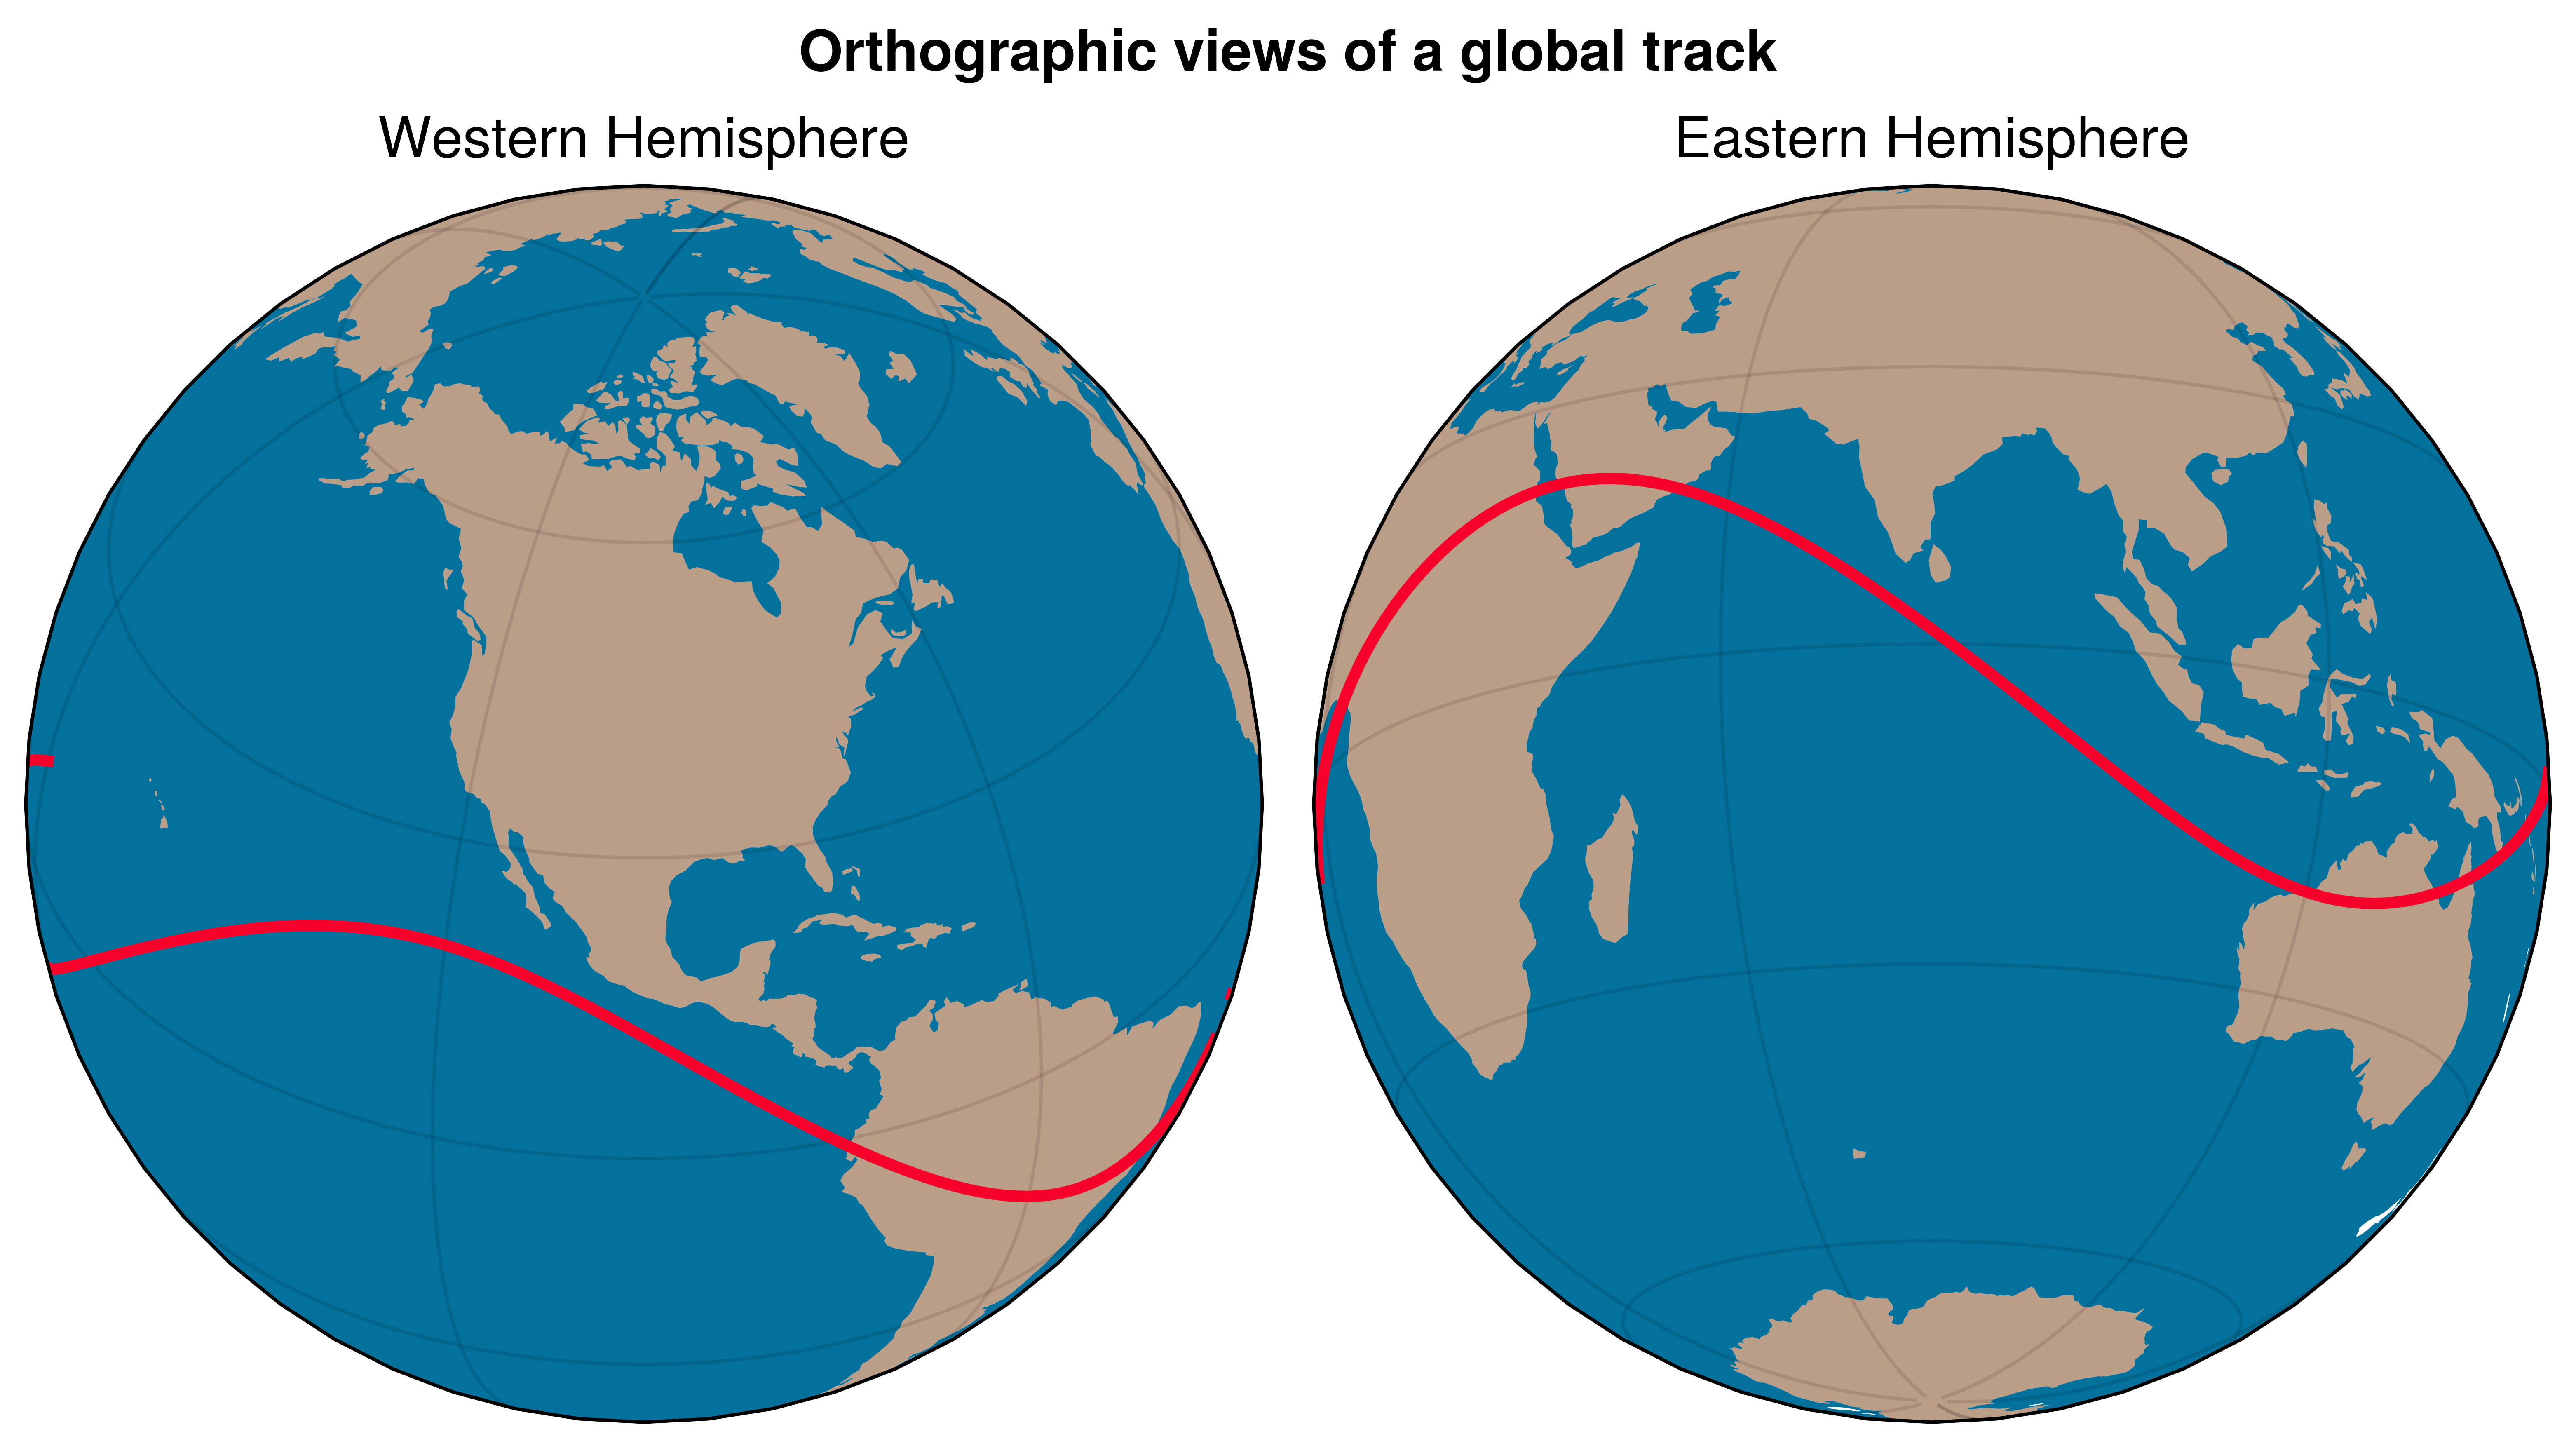
Orthographic comparison
Two orthographic views of the same signal to emphasize projection control.
Why UltraPlot here?
UltraPlot handles multiple projections in one figure with a consistent API and shared formatting calls. This makes side-by-side map comparisons simple.
Key functions: ultraplot.figure.Figure.subplot(), ultraplot.axes.GeoAxes.format().
See also
import cartopy.crs as ccrs
import numpy as np

import ultraplot as uplt

lon = np.linspace(-180, 180, 220)
lat = 20 * np.sin(np.deg2rad(lon * 2.2))

fig = uplt.figure(refwidth=3, share=0)
ax1 = fig.subplot(121, proj="ortho", proj_kw={"lon0": -100, "lat0": 35})
ax2 = fig.subplot(122, proj="ortho", proj_kw={"lon0": 80, "lat0": -15})

for ax, title in zip([ax1, ax2], ["Western Hemisphere", "Eastern Hemisphere"]):
    ax.plot(lon, lat, transform=ccrs.PlateCarree(), lw=2, color="cherry red")
    ax.scatter(lon[::40], lat[::40], transform=ccrs.PlateCarree(), s=30)
    ax.format(
        lonlines=60,
        latlines=30,
        title=title,
        land=True,
        ocean=True,
        oceancolor="ocean blue",
        landcolor="mushroom",
    )

fig.format(suptitle="Orthographic views of a global track")

fig.show()
Total running time of the script: (0 minutes 2.740 seconds)