Note
Go to the end to download the full example code.
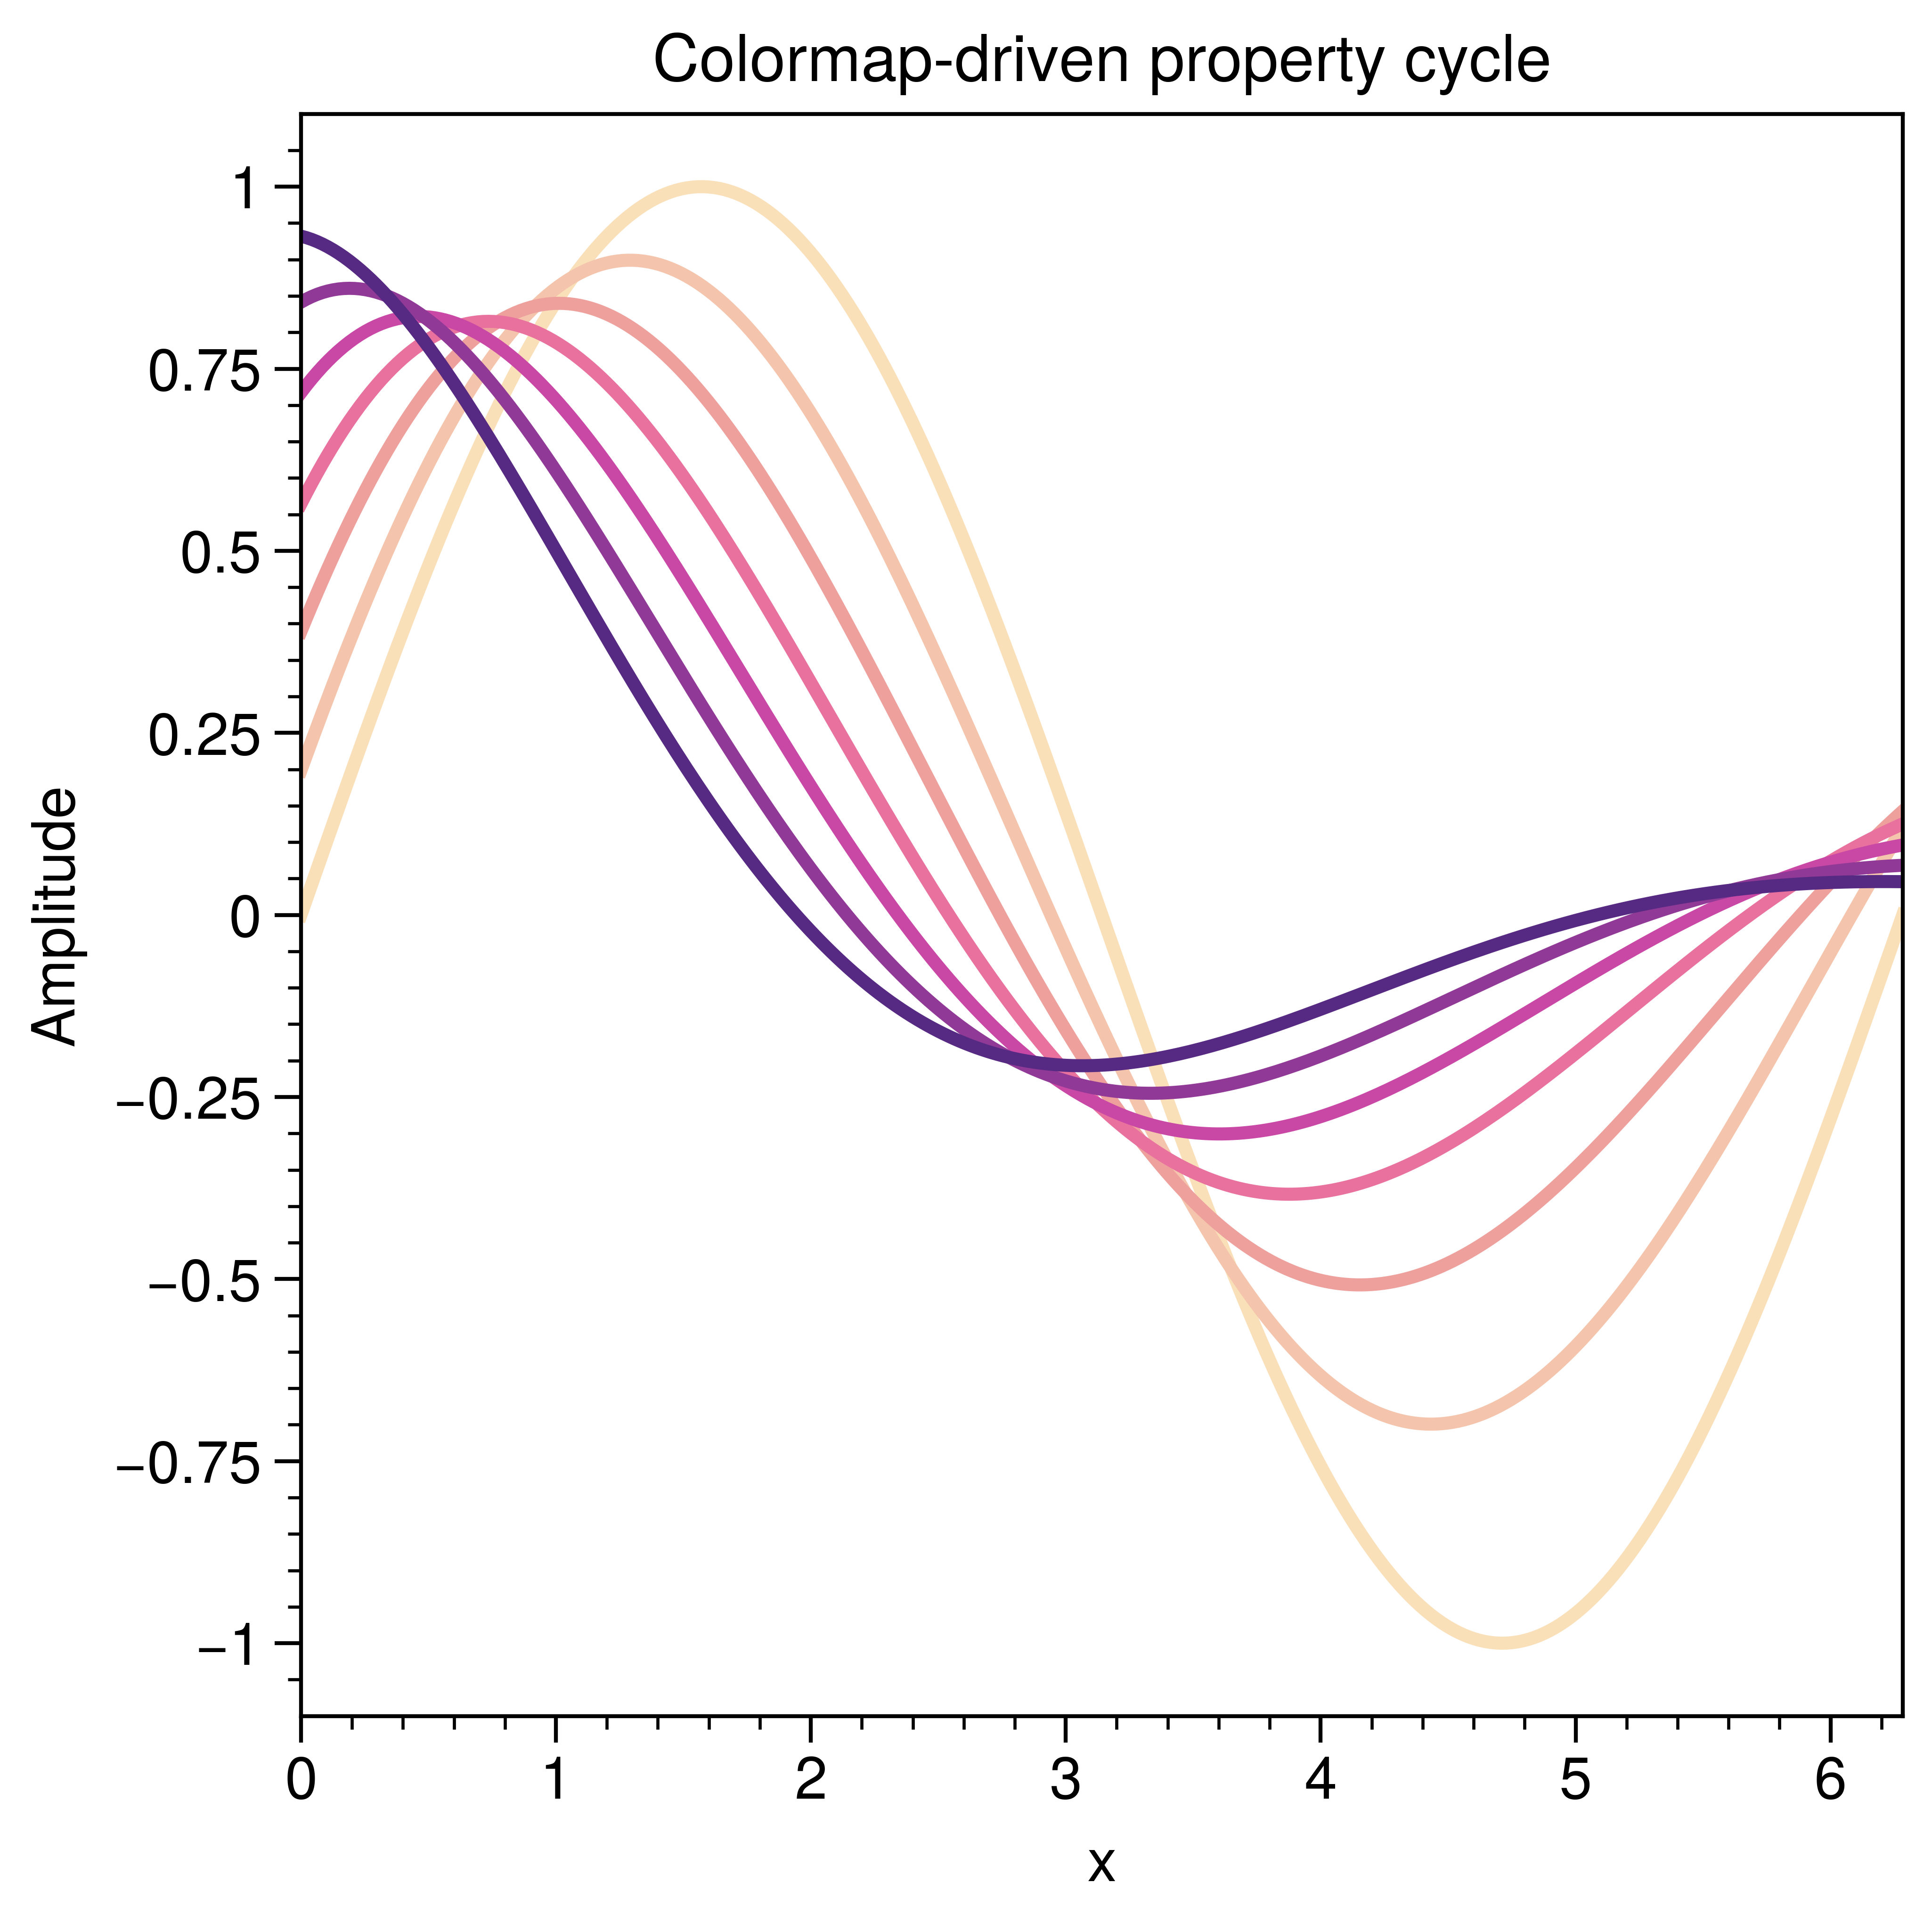
Colormap-driven cycles
Generate a publication-style line stack using a colormap cycle.
Why UltraPlot here?
UltraPlot exposes Cycle for colormap-driven property cycling, making it easy
to coordinate color and style across a line family. This is more ergonomic than
manual cycler setup in Matplotlib.
Key functions: ultraplot.Cycle, ultraplot.axes.PlotAxes.plot().
See also
import numpy as np

import ultraplot as uplt

x = np.linspace(0, 2 * np.pi, 300)
phases = np.linspace(0, 1.2, 7)
cycle = uplt.Cycle("Sunset", len(phases), left=0.1, right=0.9)

fig, ax = uplt.subplots(refwidth=3.4)
for i, phase in enumerate(phases):
    y = np.sin(x + phase) * np.exp(-0.08 * x * i)
    ax.plot(x, y, lw=2, cycle=cycle, cycle_kw={"N": len(phases)})

ax.format(
    title="Colormap-driven property cycle",
    xlabel="x",
    ylabel="Amplitude",
    grid=False,
)

fig.show()