Note
Go to the end to download the full example code.
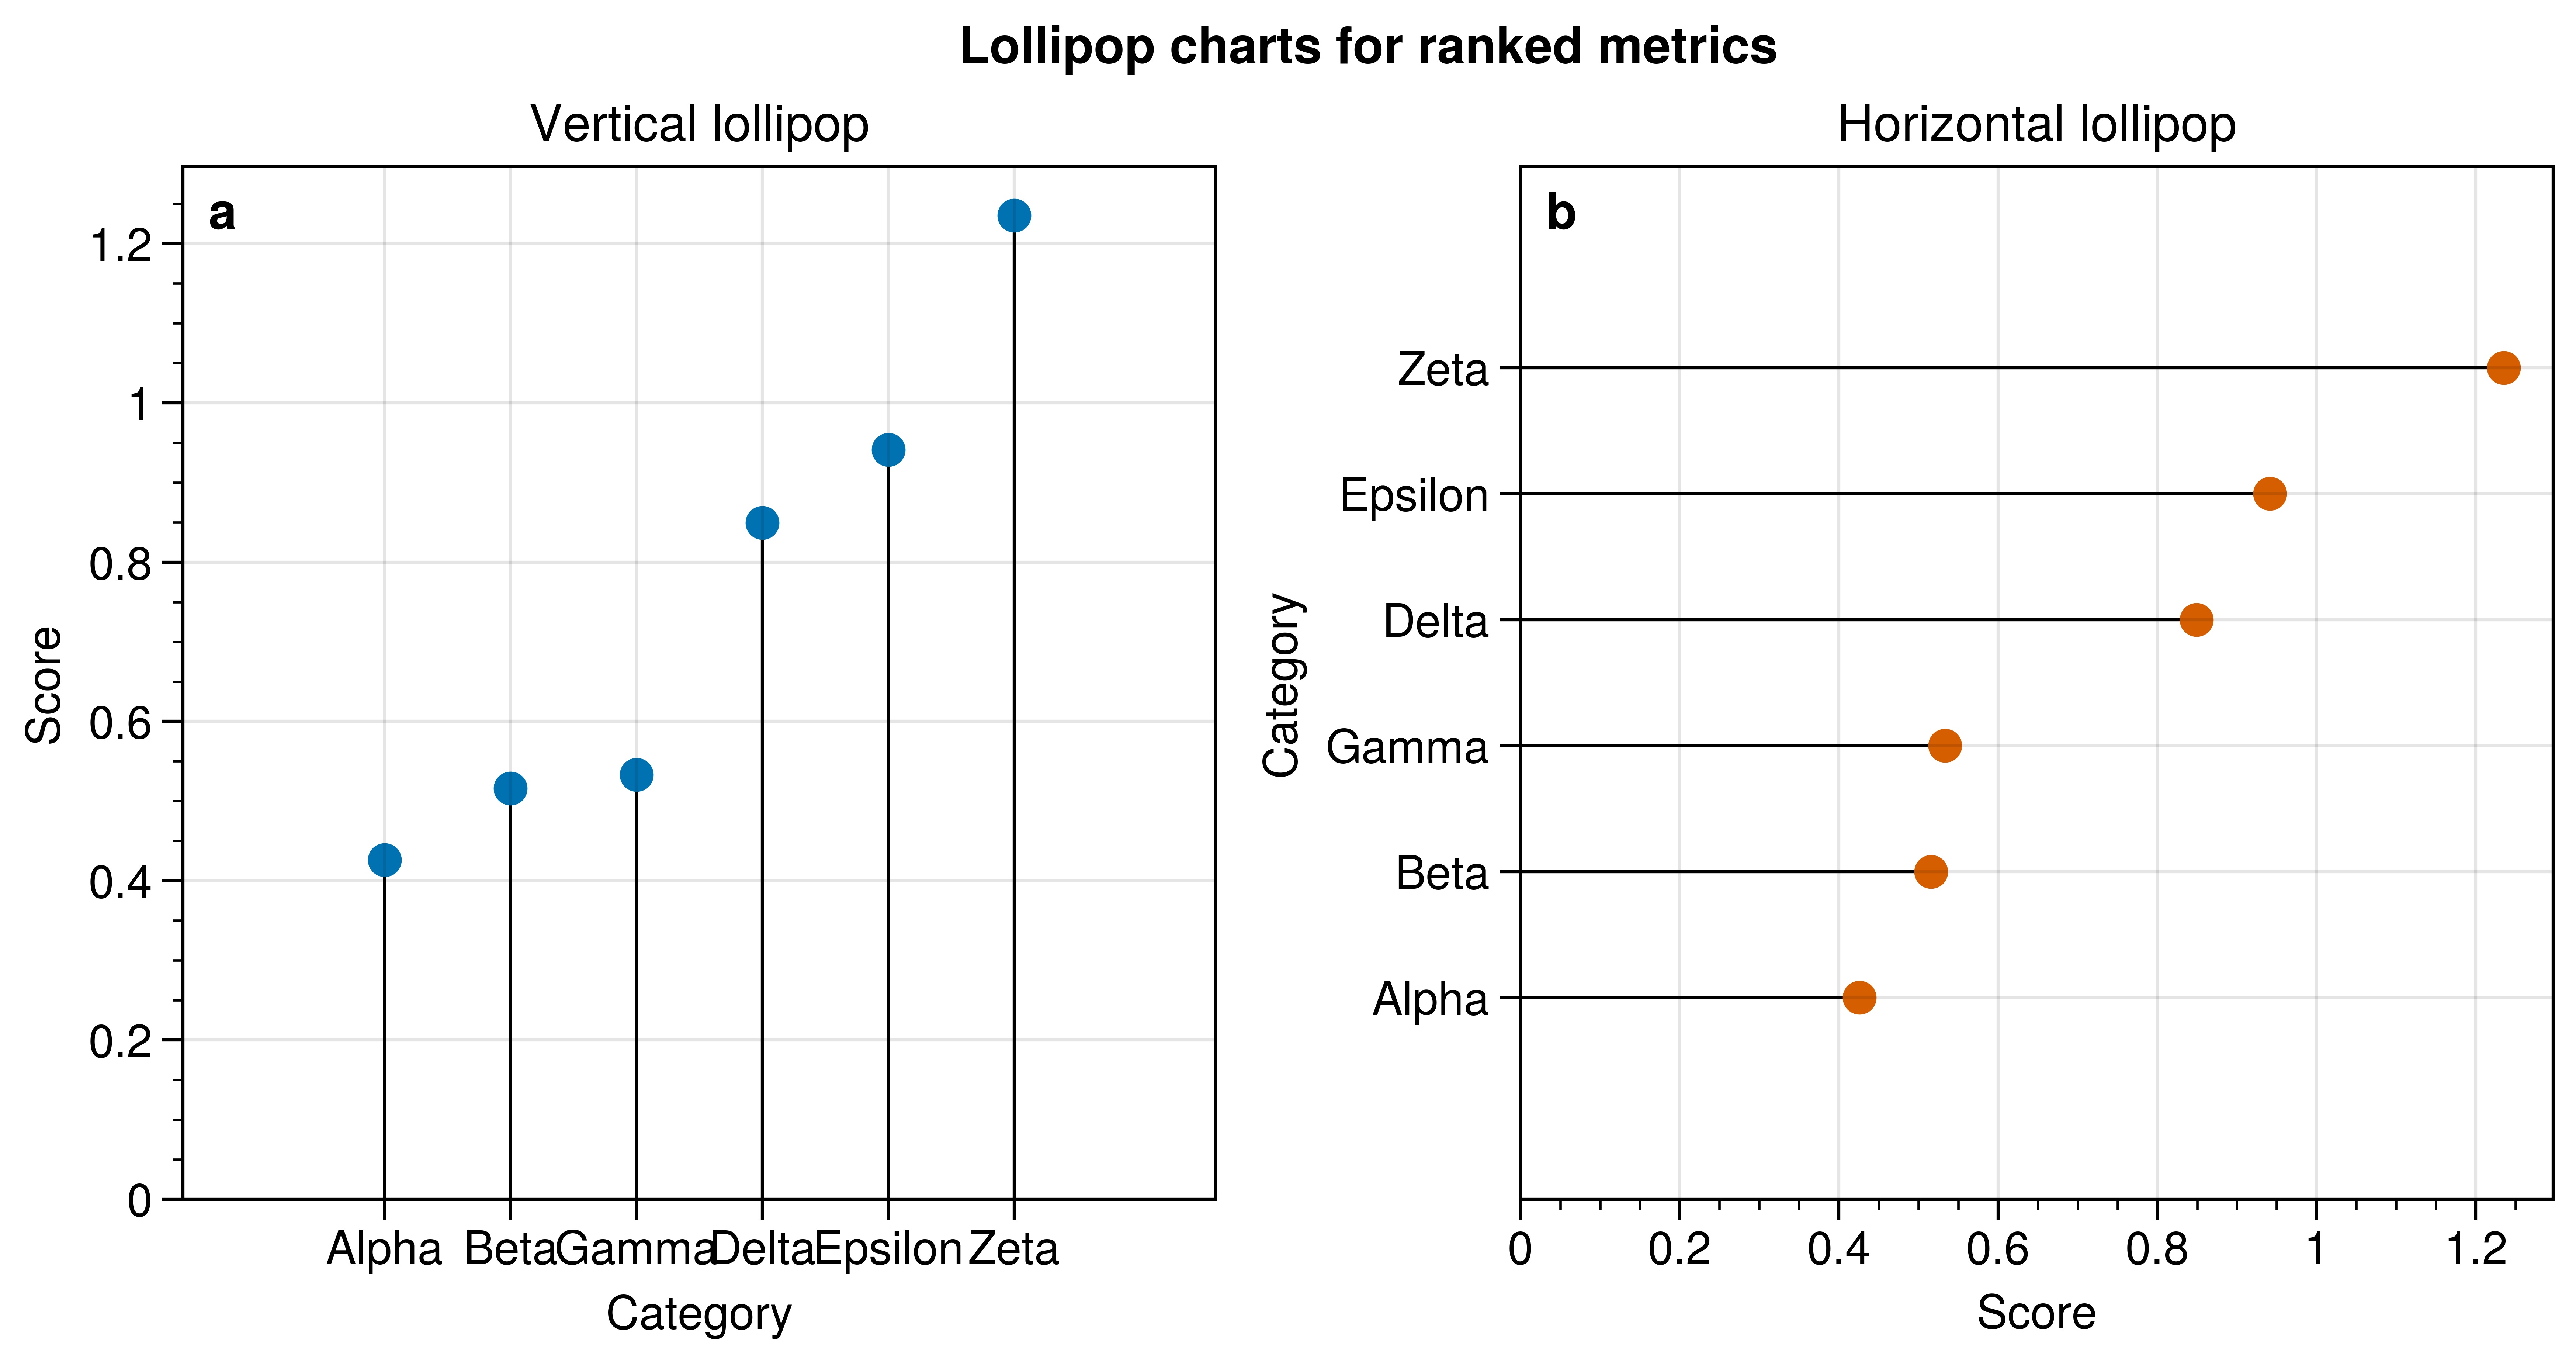
Lollipop comparisons
Vertical and horizontal lollipop charts in a publication layout.
Why UltraPlot here?
UltraPlot adds lollipop plot methods that mirror bar plotting while exposing simple styling for stems and markers. This plot type is not built into Matplotlib.
Key functions: ultraplot.axes.PlotAxes.lollipop(), ultraplot.axes.PlotAxes.lollipoph().
See also
/home/docs/checkouts/readthedocs.org/user_builds/ultraplot/checkouts/465/docs/examples/plot_types/03_lollipop.py:31: UltraPlotWarning: Got conflicting or duplicate keyword arguments: {'colors': 'C0', 'color': (0.0, 0.4470588235294118, 0.6980392156862745, 1.0)}. Using the first keyword argument.
  axs[0].lollipop(data, stemcolor="black", marker="o", color="C0")
/home/docs/checkouts/readthedocs.org/user_builds/ultraplot/checkouts/465/docs/examples/plot_types/03_lollipop.py:34: UltraPlotWarning: Got conflicting or duplicate keyword arguments: {'colors': 'C1', 'color': (0.0, 0.4470588235294118, 0.6980392156862745, 1.0)}. Using the first keyword argument.
  axs[1].lollipoph(data, stemcolor="black", marker="o", color="C1")
import numpy as np
import pandas as pd

import ultraplot as uplt

rng = np.random.default_rng(11)
categories = ["Alpha", "Beta", "Gamma", "Delta", "Epsilon", "Zeta"]
values = np.sort(rng.uniform(0.4, 1.3, len(categories)))
data = pd.Series(values, index=categories, name="score")

fig, axs = uplt.subplots(ncols=2, share=0, refwidth=2.8)
axs[0].lollipop(data, stemcolor="black", marker="o", color="C0")
axs[0].format(title="Vertical lollipop", xlabel="Category", ylabel="Score")

axs[1].lollipoph(data, stemcolor="black", marker="o", color="C1")
axs[1].format(title="Horizontal lollipop", xlabel="Score", ylabel="Category")

axs.format(abc=True, abcloc="ul", suptitle="Lollipop charts for ranked metrics")

fig.show()
Total running time of the script: (0 minutes 1.576 seconds)