Note
Go to the end to download the full example code.
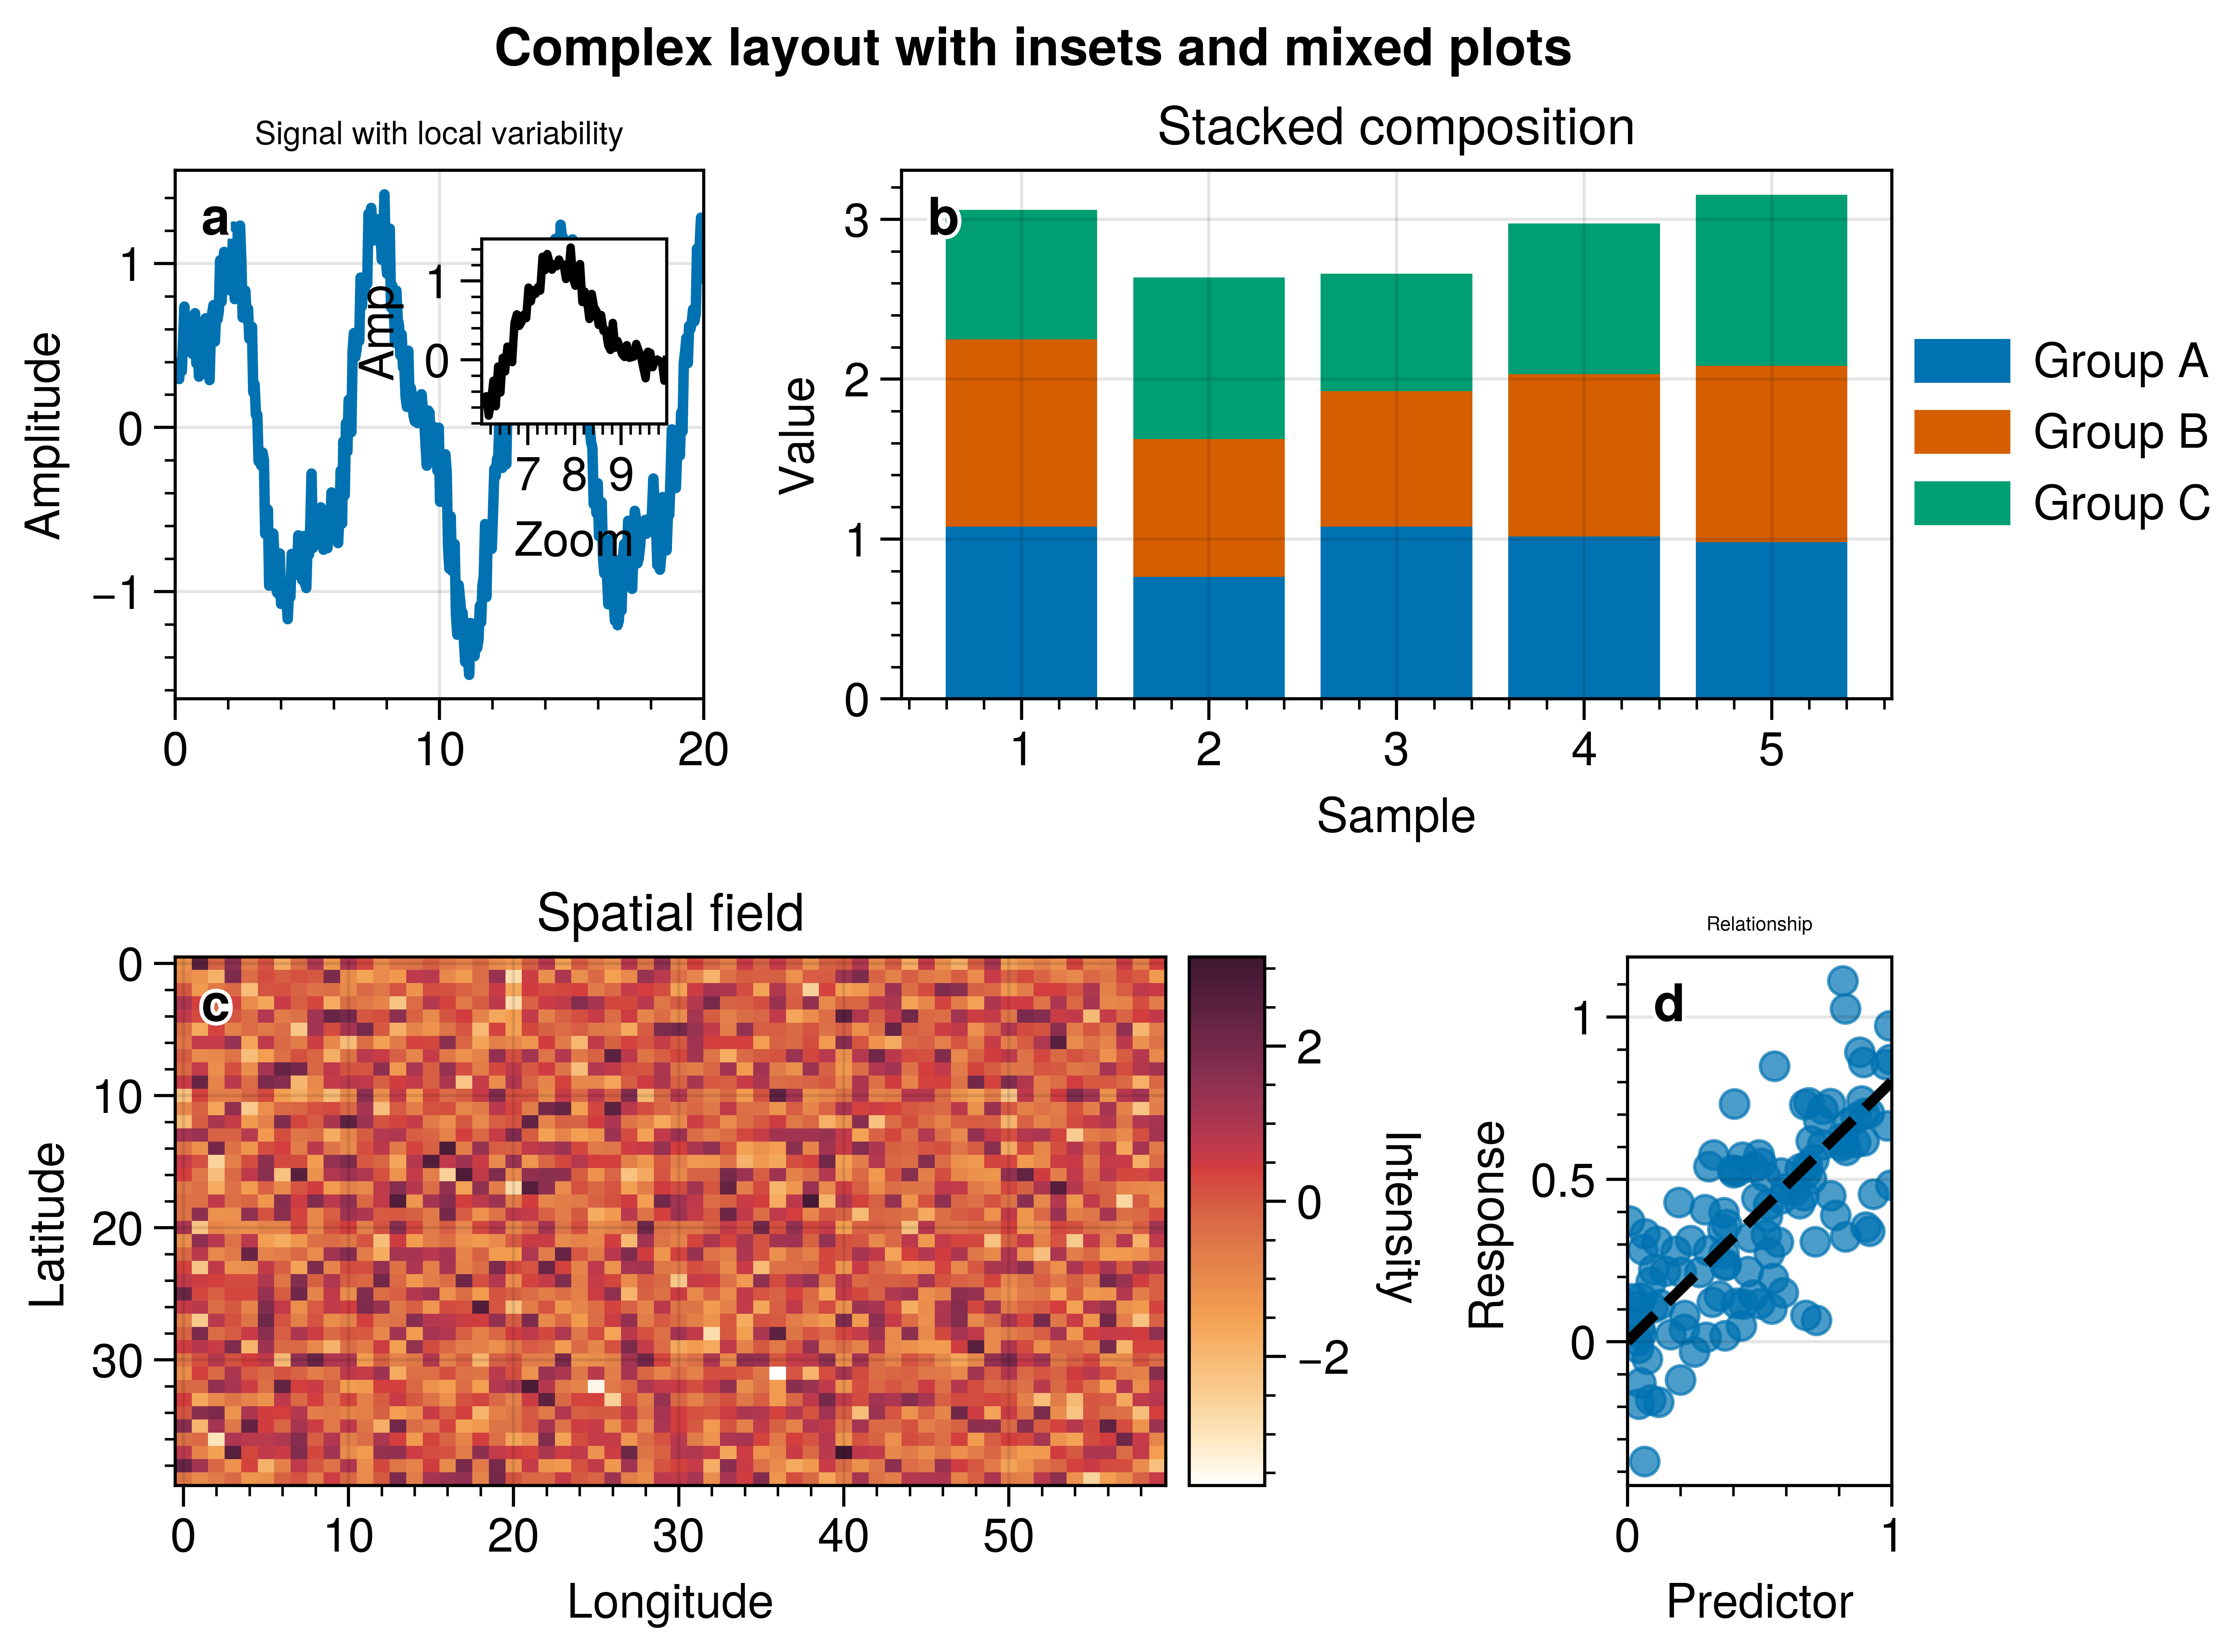
Complex layout with insets
A mixed layout using blank slots, insets, and multiple plot types.
Why UltraPlot here?
UltraPlot accepts nested layout arrays directly and keeps spacing consistent across panels and insets. You get a publication-style multi-panel figure without manual GridSpec bookkeeping.
Key functions: ultraplot.subplots(), ultraplot.axes.Axes.inset_axes().
See also
import numpy as np

import ultraplot as uplt

rng = np.random.default_rng(7)
layout = [[1, 1, 2, 2], [3, 3, 3, 4]]
fig, axs = uplt.subplots(layout, share=0, refwidth=1.4)

# Panel A: time series with inset zoom.
x = np.linspace(0, 20, 400)
y = np.sin(x) + 0.3 * np.cos(2.5 * x) + 0.15 * rng.standard_normal(x.size)
axs[0].plot(x, y, lw=2)
axs[0].format(title="Signal with local variability", ylabel="Amplitude")
inset = axs[0].inset_axes([0.58, 0.52, 0.35, 0.35], zoom=0)
mask = (x > 6) & (x < 10)
inset.plot(x[mask], y[mask], lw=1.6, color="black")
inset.format(xlabel="Zoom", ylabel="Amp", grid=False)

# Panel B: stacked bar chart.
categories = np.arange(1, 6)
vals = rng.uniform(0.6, 1.2, (3, categories.size)).cumsum(axis=0)
axs[1].bar(categories, vals[0], label="Group A")
axs[1].bar(categories, vals[1] - vals[0], bottom=vals[0], label="Group B")
axs[1].bar(categories, vals[2] - vals[1], bottom=vals[1], label="Group C")
axs[1].format(title="Stacked composition", xlabel="Sample", ylabel="Value")
axs[1].legend(loc="right", ncols=1, frame=False)

# Panel C: heatmap with colorbar.
grid = rng.standard_normal((40, 60))
image = axs[2].imshow(grid, cmap="Fire", aspect="auto")
axs[2].format(title="Spatial field", xlabel="Longitude", ylabel="Latitude")
axs[2].colorbar(image, loc="r", label="Intensity")

# Panel D: scatter with trend line.
x = rng.uniform(0, 1, 120)
y = 0.8 * x + 0.2 * rng.standard_normal(x.size)
axs[3].scatter(x, y, s=30, alpha=0.7)
axs[3].plot([0, 1], [0, 0.8], lw=2, color="black", linestyle="--")
axs[3].format(title="Relationship", xlabel="Predictor", ylabel="Response")

axs.format(abc=True, abcloc="ul", suptitle="Complex layout with insets and mixed plots")

fig.show()
Total running time of the script: (0 minutes 1.533 seconds)