Note
Go to the end to download the full example code.
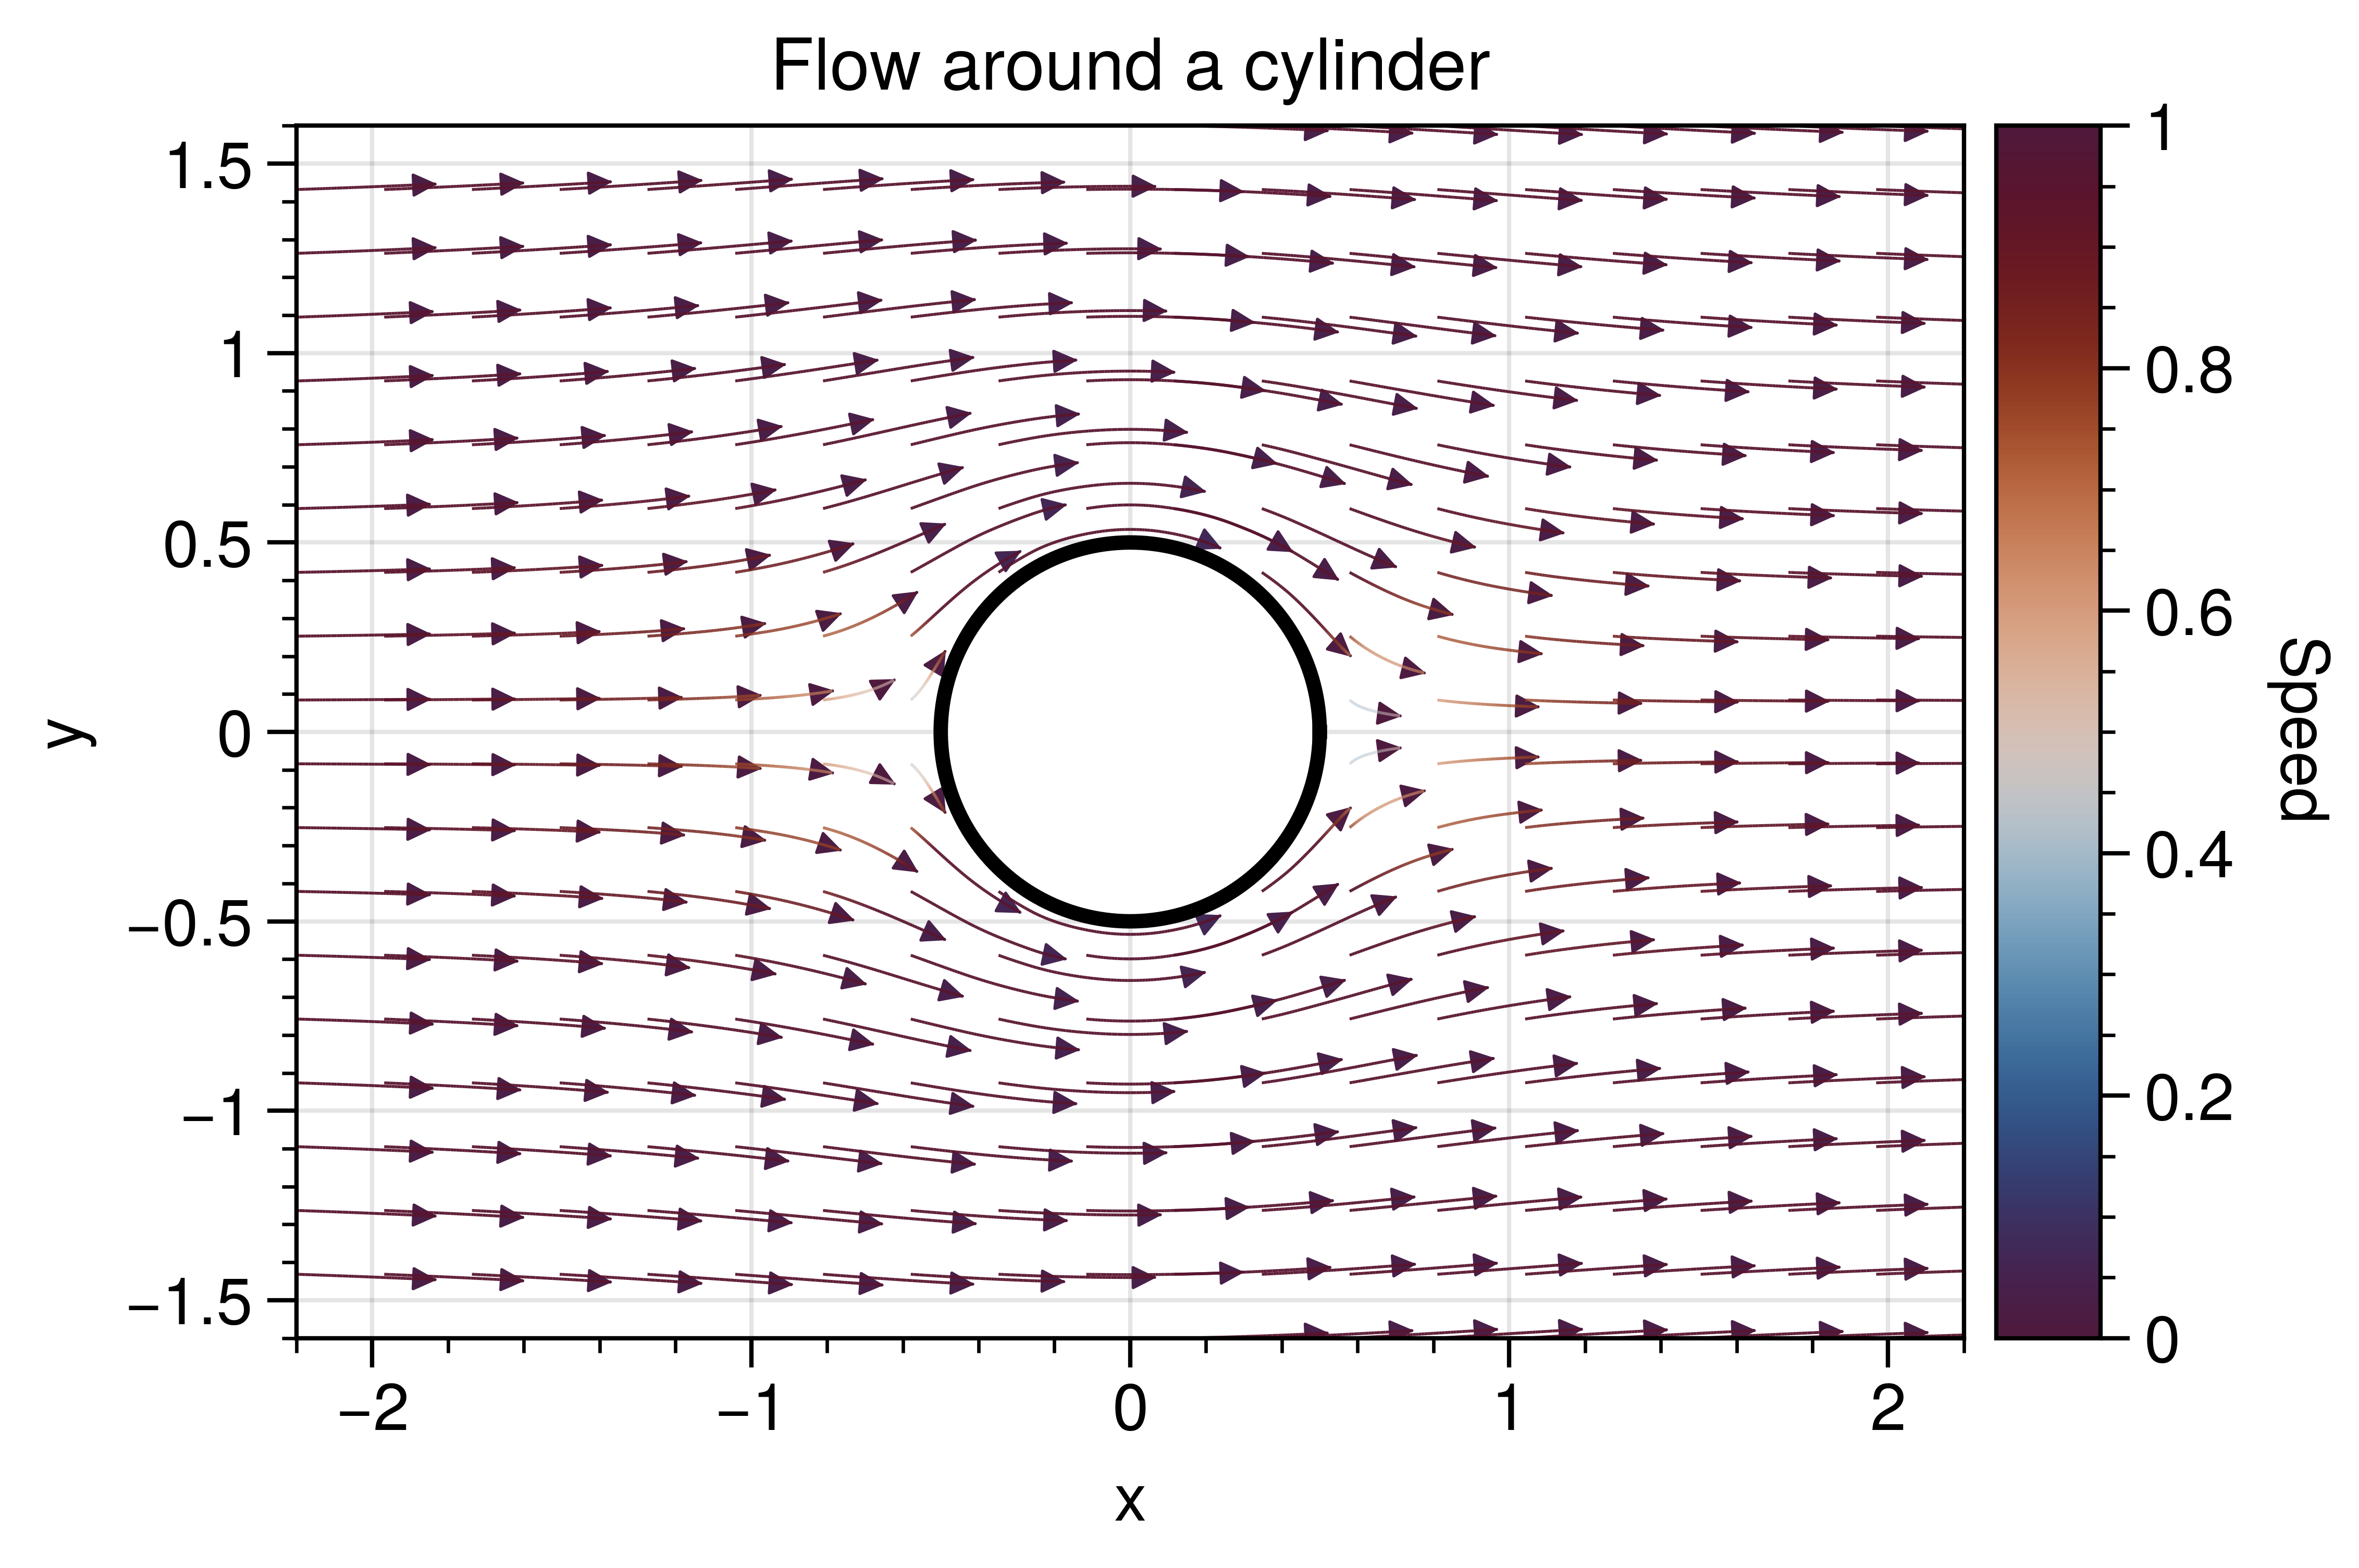
Curved quiver around a cylinder
Streamline-style arrows showing flow deflection around a cylinder.
Why UltraPlot here?
curved_quiver is an UltraPlot extension that draws smooth, curved arrows
for vector fields while preserving color mapping. This is not available in
base Matplotlib.
Key functions: ultraplot.axes.PlotAxes.curved_quiver(), ultraplot.figure.Figure.colorbar().
See also
import numpy as np

import ultraplot as uplt

x = np.linspace(-2.2, 2.2, 26)
y = np.linspace(-1.6, 1.6, 22)
X, Y = np.meshgrid(x, y)

# Potential flow around a cylinder (radius a=0.5).
U0 = 1.0
a = 0.5
R2 = X**2 + Y**2
R2 = np.where(R2 == 0, np.finfo(float).eps, R2)
U = U0 * (1 - a**2 * (X**2 - Y**2) / (R2**2))
V = -2 * U0 * a**2 * X * Y / (R2**2)
speed = np.sqrt(U**2 + V**2)

fig, ax = uplt.subplots(refwidth=3.2)
m = ax.curved_quiver(
    X,
    Y,
    U,
    V,
    color=speed,
    arrow_at_end=True,
    scale=30,
    arrowsize=0.7,
    linewidth=0.4,
    density=20,
    grains=20,
    cmap="viko",
)
m.lines.set_clim(0.0, 1.0)
values = m.lines.get_array()
if values is not None and len(values) > 0:
    normed = np.clip(m.lines.norm(values), 0.05, 0.95)
    colors = m.lines.get_cmap()(normed)
    colors[:, -1] = 0.15 + 0.85 * normed
    m.lines.set_color(colors)
    m.arrows.set_alpha(0.6)
theta = np.linspace(0, 2 * np.pi, 200)
facecolor = ax.get_facecolor()
ax.fill(
    a * np.cos(theta),
    a * np.sin(theta),
    color=facecolor,
    zorder=5,
)
ax.plot(a * np.cos(theta), a * np.sin(theta), color="black", lw=2, zorder=6)
ax.format(
    title="Flow around a cylinder",
    xlabel="x",
    ylabel="y",
    aspect=1,
)
fig.colorbar(m.lines, ax=ax, label="Speed")

fig.show()
Total running time of the script: (0 minutes 2.431 seconds)